Organic analysis
The analytical chemistry of organic compounds is significantly different from the inorganic analytical chemistry, because there isn’t a variety of elements like in the inorganic chemistry. The relevant elements in the organic chemistry are C, H, O, N, S, P, and halogens which form a multiplicity of different molecules. Nowadays, there are known several million different organic compounds. A further significant difference is the change in structure and composition of organic compounds which takes place by metabolism in the natural environment. These are for example photochemical-induced reactions, and microbial or chemical metabolisms which lead to a degradation of molecules. For this reason, many chemicals "disappear" from environment and can’t be detected by analytical chemistry, but their metabolites can be.
This is why the separation and clean-up procedure of complex mixtures of environmental samples is so complicated in the organic analytical chemistry. This fact was taken into account by the choice of the experiments. Separation methods and their basics will be explained and done in detail.
The first experiment belongs to chromatographical separation methods and shows its main principle: leaf pigments will be separated on chalk and – in another experiment – quantified by UV-VIS measurement. A comparison of different systems and different detectors should indicate the spectrum of the potentialities, but also of the limitations of analytical methods. As an example, BTX (Benzene, Toluene, Xylene) will be extracted from real water samples by using liquid/liquid-extraction and then be analyzed with gas chromatography. During all experiments, basic principles of quality assurance (internal and external standardization, calibration, statistical evaluation of results) will be used.
Basics of chromatographic detection
In the instrumental analysis, the reproducibility of the measurement is the critical parameter, which estimates the utility resp. the practicability of an analytical method for a specific problem. Therefore it has to be known, which factors affected the reproducibility of the results.
The important parameters for the chromatographic analysis are:
- Type of stationary and mobile phase
- Composition of the sample and the analytes
- Sample injection technique and injector systems (particularly in GC)
- Temperature, pressure, flow velocity of the mobile phase
- Detector selection, sensitivity
- Data processing, chromatograms
The chromatographic systems, like gas chromatography (GC), high performance liquid chromatography (HPLC), and ion chromatography (IC) are different following the points mentioned above. Despite of this differences there are some basic principles, which are shown in mathematical equations. This leads to the following chromatographic terms and definitions.
Basic terms in column chromatography (GC, HPLC, IC)
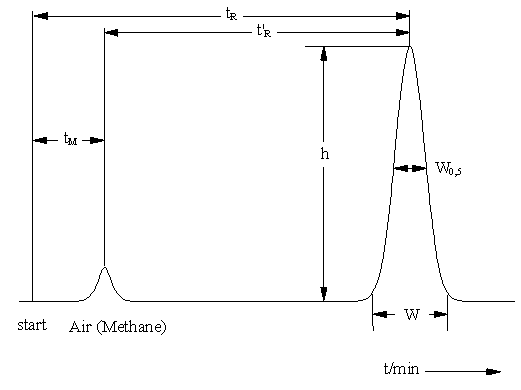
tR Total retention time of the compound (in the whole chromatographic system)
t’R Adjusted retention time of the compound (retention time in the stationary phase)
tM "Dead time" (retention time in the mobile phase)
W0,5 Peak width at half height
h Height of a signal
This yields in following equation: tR = t’R + tM
With regard to the column’s geometry, the mobile phase has a specific volume. Assuming a constant eluent flow, we obtain:
VR = V’R + VM and b = V’R / VL with
VR Total retention volume
V’R Adjusted retention volume
VM Volume flow rate
VL Volume of the stationary phase
b Phase ratio (Ratio of the concentrations of a compound in the mobile and stationary phases)
In chromatography – except the exclusion chromatography, where the separation takes place due to the different molecule size of the compounds – the different migration velocity is caused by the thermodynamic distribution coefficient K of the components between stationary and mobile phases. At a constant velocity of the mobile phase, the capacity factor k’ (ratio of retention time of the compounds in the stationary and mobile phases) is a compound specific value:
The whole chromatographical process is a consequence of many interactions of the analytes with the stationary and the mobile phase. These interactions are called adsorption or partition, in case of a solid or liquid stationary phase, and desorption or elution, in case of a gaseous or liquid mobile phase. A "theoretical plate" is a part of the column, where a thermodynamic equilibrium of the analytes in the stationary and the mobile phase appears. In the "ideal" chromatography, this is a reversible process. But in reality ("not-ideal" chromatography), you have to take the effects of diffusion into consideration, which causes at least a peak form like a Gauss’ error curve.
The peak sharpness is given by the number n of these theoretical plates in the column. The lower the Height Equivalent of a Theoretical Plate H (HETP), the sharper the peaks:
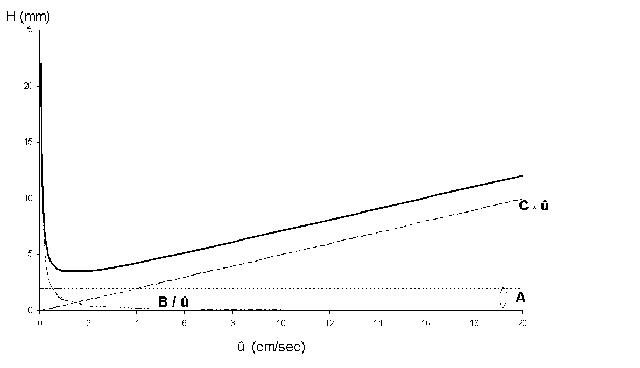
The dynamic model of chromatographical processes is an extended version of the theory of theoretical plates. In gas-liquid chromatography, diffusion effects and non-equilibriums must be considered. This is described in the Van-Deemter-equation, which gives a correlation between the height of theoretical plates H and the velocity. It also describes the transport- and diffusion processes which cause a peak distortion. From this derives an ideal flow velocity ûopt, at a minimum height of theoretical plates, and a maximum separation performance of the column, like it is shown in the following scheme.
- A Eddy diffusion (package factor) inside the column package; depends on the kind of stationary phase (e.g. dP particle size, l statistical irregulation of the package)
- B Axial molecular diffusion in the mobile phase; depends on the pore volume of the package (e.g. Dm diffusion coefficient of the mobile phase; g labyrinth factor of the pores)
- C Mass transfer coefficient in the mobile and stationary phase; takes the equilibration’s velocity in consideration (e.g. DS diffusion coefficient of the stationary phase, dP particle size)
- û Average linear velocity (cm/sec)
In practice the van-Deemter-curve (graphic presenting the height of theoretical plates versus flow velocity, which is specific for the mobile phase) provides good clues for the choice of an optimal flow velocity (head pressure).
The van-Deemter-equation demonstrates the dependence of getting sharp peaks (low HETP) from the following terms:
- small particle’s diameter (particle size),
- small column’s diameter,
- small film thickness of the stationary phase.
Qualitative analysis
In chromatography, the qualitative analysis of single components is performed by comparing retention parameters (retention time, peak form) of a reference material with the sample. In case of a constant flow, the retention time is used to identify unknown compounds. The retention time of a component is a characteristic value at constant temperature, flow, and for a particular column.
Quantification with external standard
In a defined concentration range, there is a linear dependence between peak area (resp. peak height) and analyte amount resp. concentration. As a result of this dependence, a quantification of a known compound is possible by analyzing a reference material in different concentrations (multi-point calibration) or with one concentration (one-point calibration).
Quantification with internal standard
In this procedure, the same defined amount of a compound (internal standard) will be added to the sample and all calibration standards. This compound has to have similar chemical-physical properties as the sample compounds, but must not subsist in the sample before. The internal standard can be added to the original sample before doing a clean-up procedure or could be added to the sample solution after the clean-up.
Recovery
By adding a standard solution with known concentration to an original sample (adding a "spike"), the recovery is determined by comparison of the amount in the original and the "spiked" sample. The recovery provides information about the quality of a sample preparation.


